Just Breath
|
Features: |
|
Libraries Used:
shiny shinydashboard ggplot2 lubridate DT jpeg grid leaflet View dashboard here: |
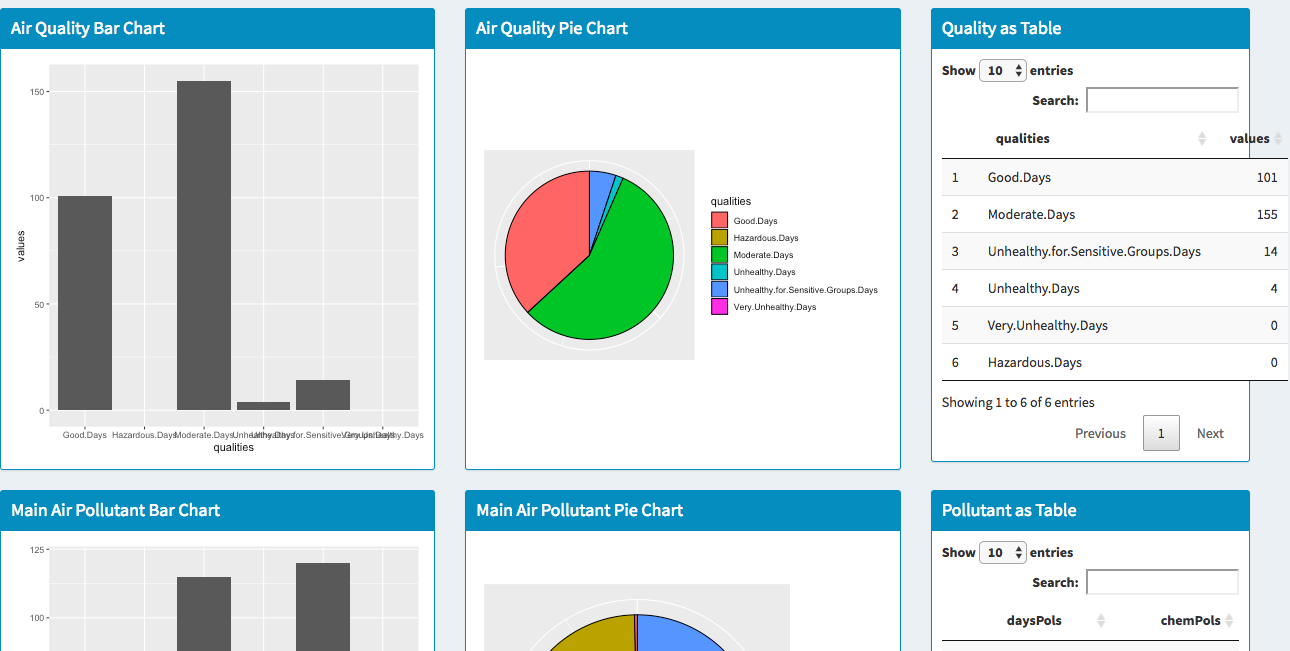
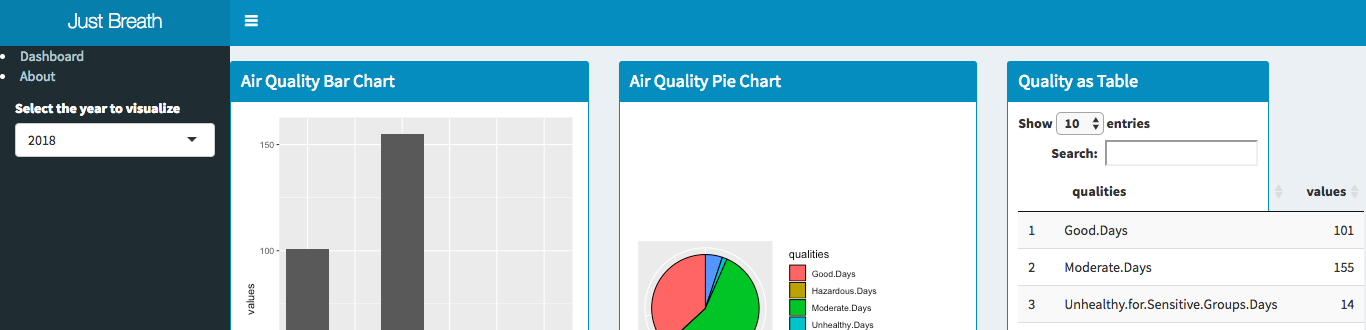
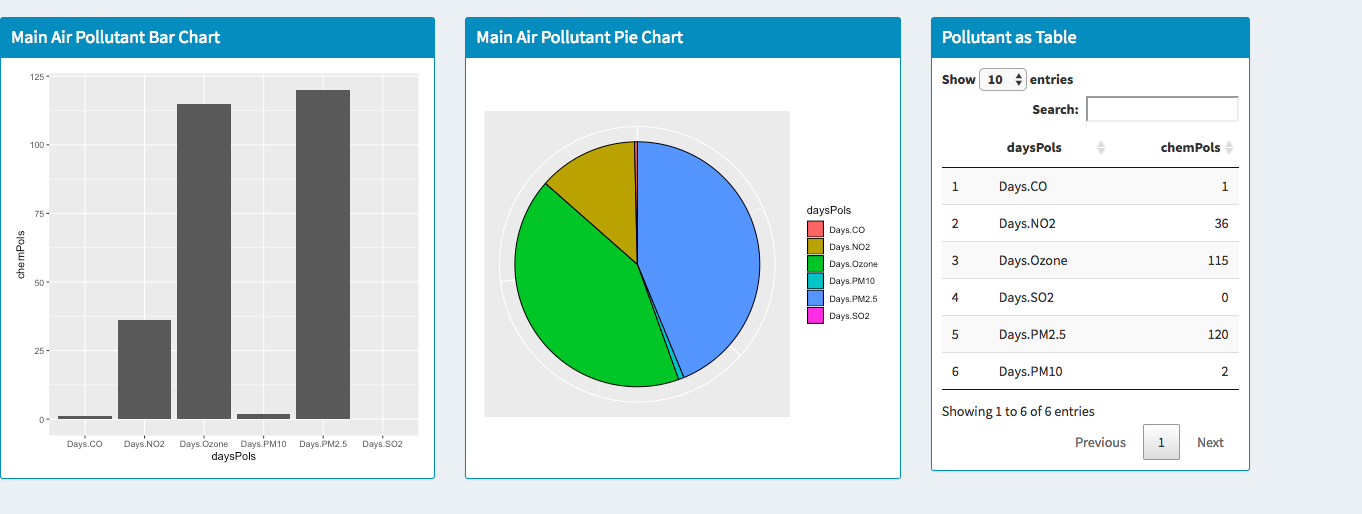
My app allows the user to pick a tab between Dashboard and About. The about tab leads them here where they can see more details. The Dashboard tab takes them to a breakdown of a table, bar graph and pie chart of the main pollutants of Cook County. It also shows this information for the quality of the air in Cook County. The side bar allows user to choose a year as well. This side bar is also collapsable.
|
