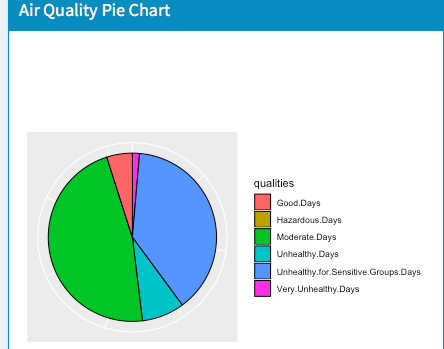
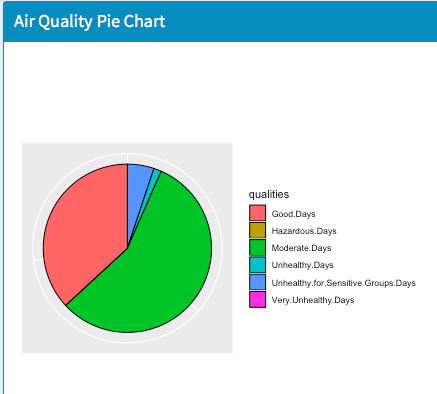
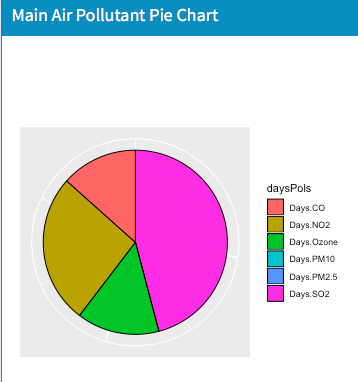
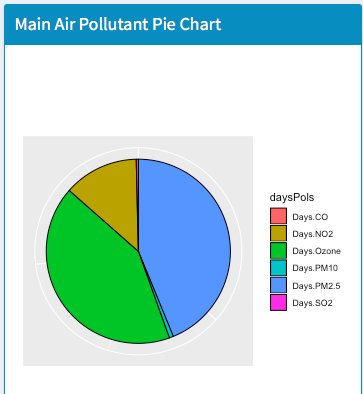
I did notice that during the 90s the average hazardous and dangerous days were a lot more common. This was easiest to see using the pie chart. I also noticed that we have pretty much ended the output of SO2 since 1980 in which it was the most common main pollutant. This decrease started in the 2000's and a shift began to happen towards NO2 and the days Ozone. We can also see that there. I have attached pie charts from 1980 vs 2018 respectively of the pie charts for main pollutants and air quality.
|
|
|
|
Although these charts show both extremes, the general trend is that the shift happened gradually from a dependancy on SO2 gasses which was harming the air quality to PM10 and Days ozone which made the air quality better in turn.
